Experiment status
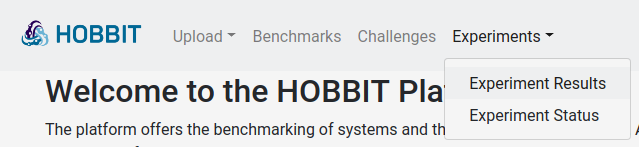
Any user can see the current status of the platform and the configured experiments, e.g., for checking whether the own experiment is already being executed. The status page can be reached by clicking on Experiments and Experiment status.
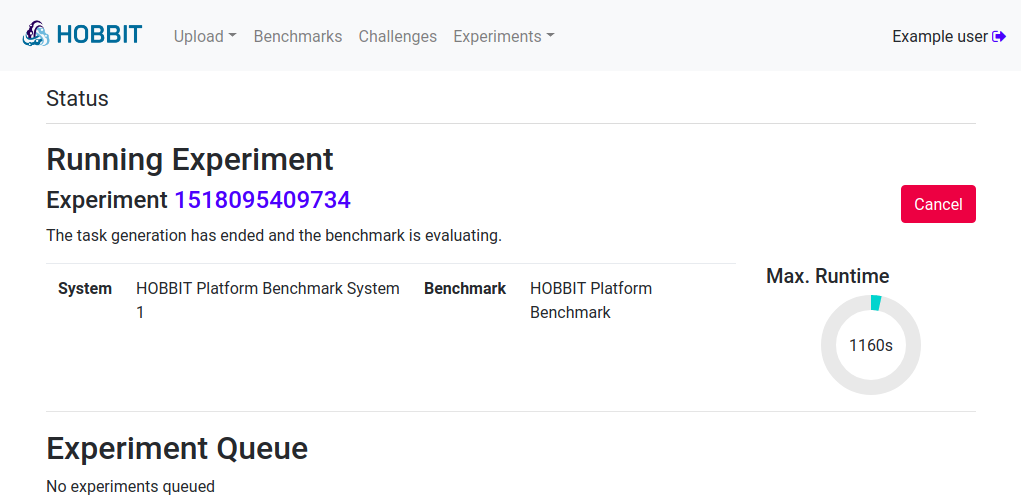
The page shows the experiment that is executed at the moment. This includes general information as well as the phase the experiment is in and the maximum run time that this experiment will take. If the user started this experiment, a Delete button is displayed which can be used to stop the experiment.
Below the executed experiment, the queue of waiting experiments is shown. Experiments configured by the user can be removed from the list using the Delete button.
Explore experiment results
Any user can explore published results of experiments. Additionally, registered users can explore unpublished results for their systems, e.g., results in a challenge that has not published its complete result list. Challenge owners are allowed to see the results of all experiments that belong to their challenge allowing them to see and announce the best performing system even if the results haven’t been published.
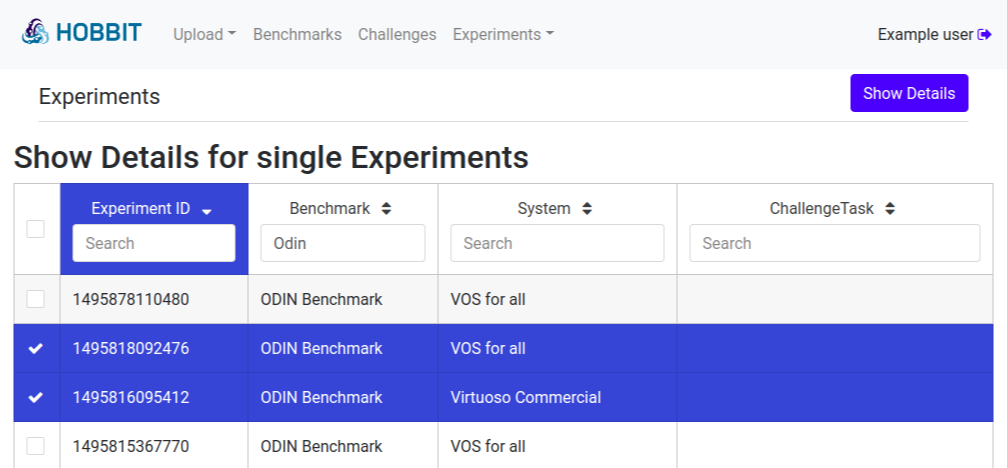
In order to see the results the user selects the Experiment Results page of the Experiments menu item.
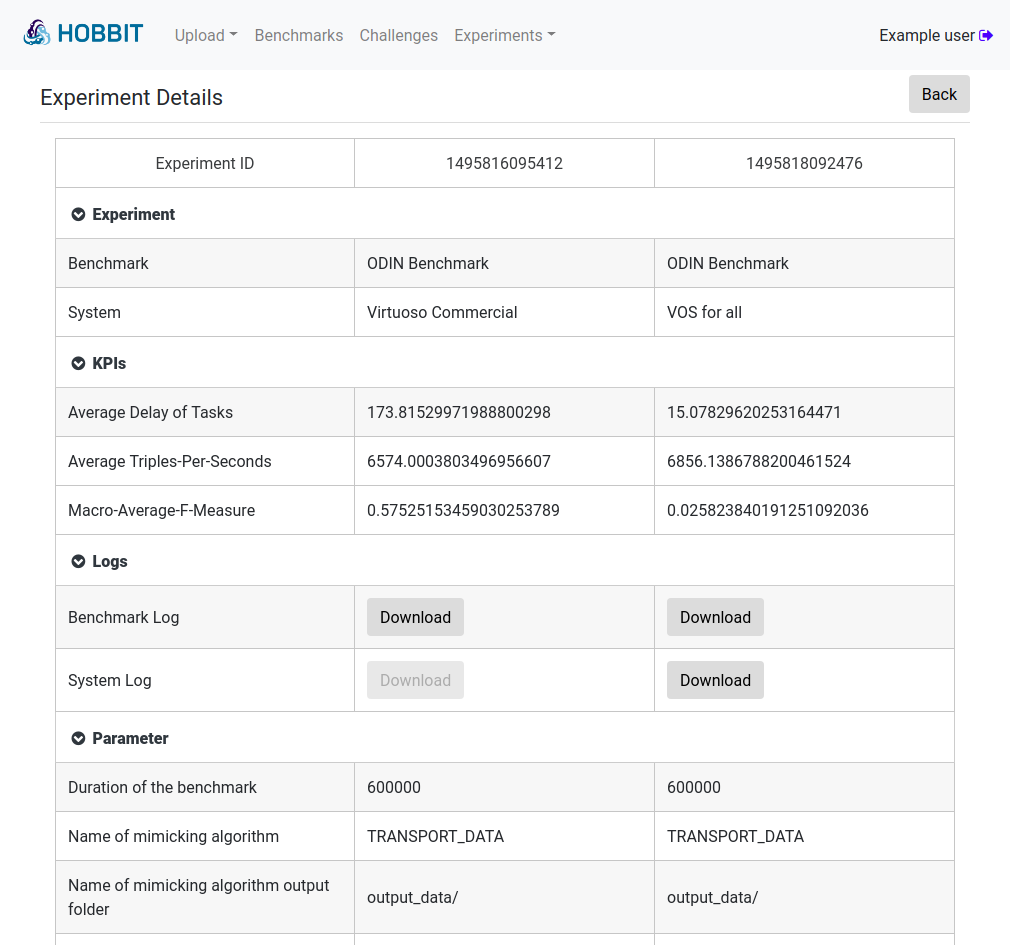
The results page displays the details of finished experiments the user is allowed to explore.
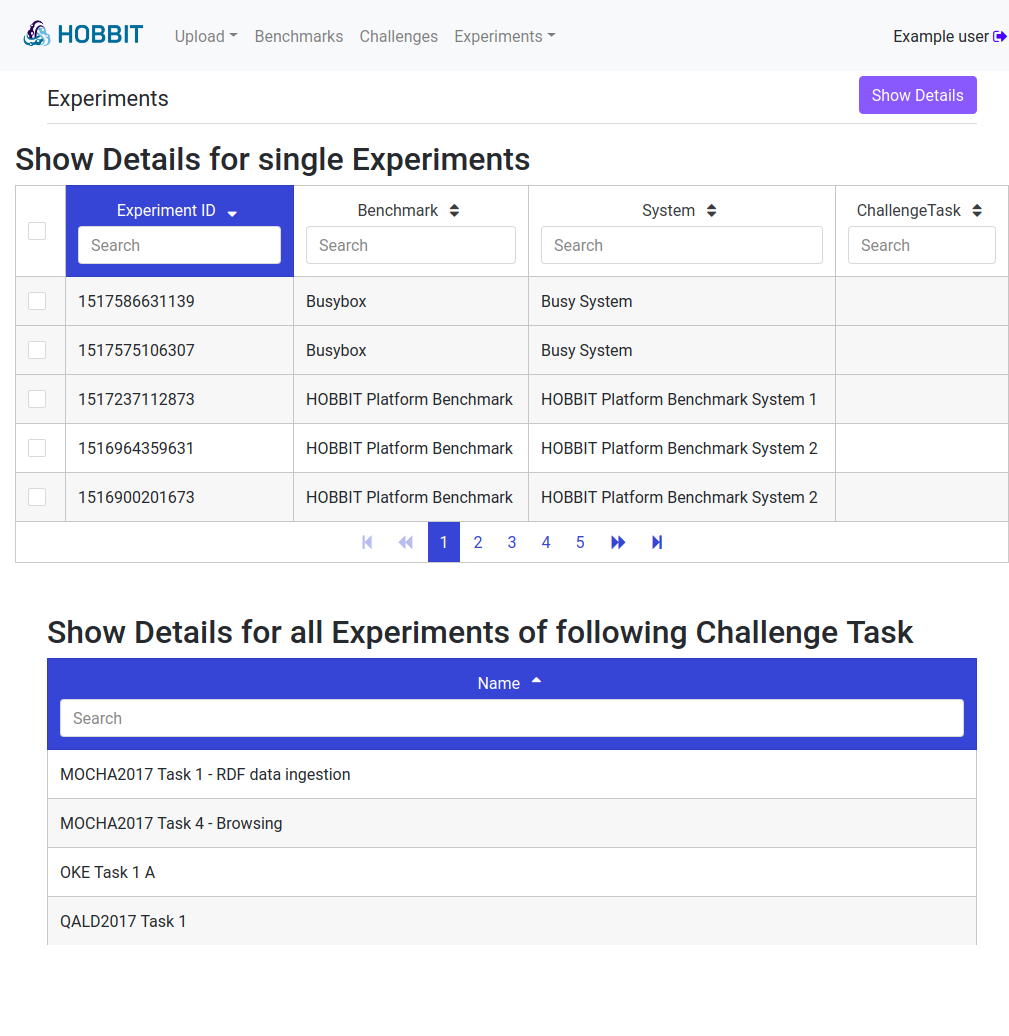
One can select various experiments in order to compare the results of these experiments or only select one experiment to explore its result. The results are displayed after pressing the Show Details button. The list of experiments can be filtered to search for certain systems, benchmarks or challenge tasks. To see all results of a specific challenge task it is also possible to simply select the task at the bottom of the page.
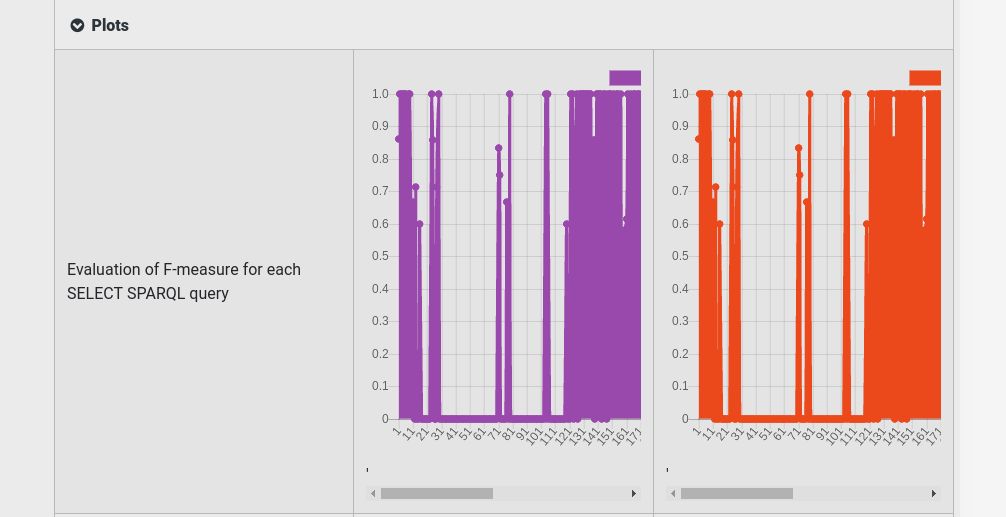
The results are displayed next to each other. The result table comprises five parts: 1) General information about the experiment, 2) the measured KPIs, 3) experiment logs, 4) benchmark parameters and 5) the visualisation of result sets as diagrams. If the experiment caused and logged an error, it is displayed as well. The error will be highlighted.